
To create a KPI using the progress chart type, follow the steps below.
- Create a report through Salesforce. You can learn how to do that in the Reports & Dashboards for Lightning Experience trailhead.
- In our example, the Report type is Points with Member and is Grouped By Currency.
- Save the report in the Public Reports folder. Its name will be "Challenge Members" (unique name "Challenge_Members_0IC").
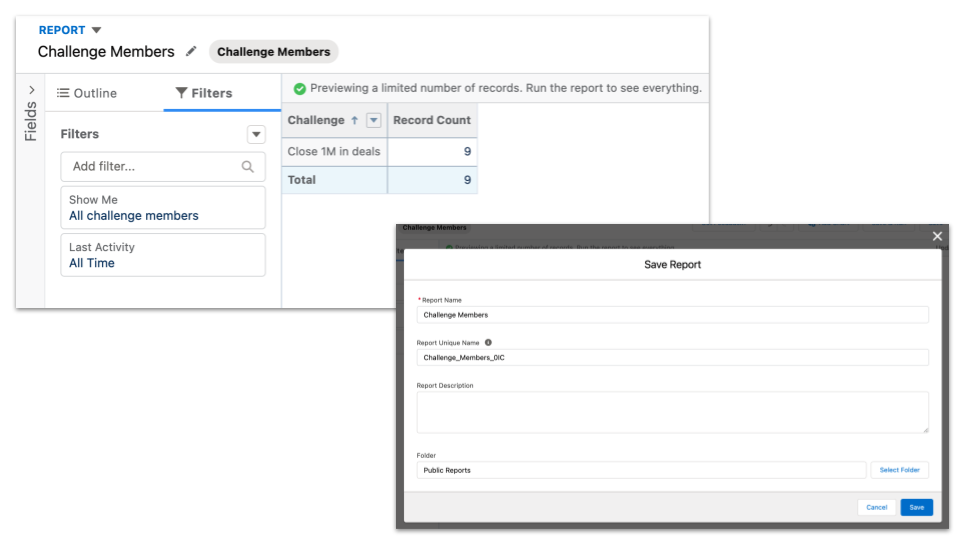
Report example - Progress chart type
- From the Fielo Platform, go to the Tools tab.
- Enter the FieloLocal library and, from there, click on the Analytics section.
- Click New and provide the following information. The fields not displayed here can be left blank.
| Field | Value |
|---|---|
| KPI Name | Challenge Members |
| External Id | ChallengeMembers |
| Available Charts | Progress,Progress 2 |
| Library | FieloLocal |
| Type | Challenge |
| Report Filter | |
| Report Type | Standard |
| Report Objective Field | RowCount |
| Report Unique Name | Challenge_Members_0IC |
| Report Metadata | {"size":"small","styleClass":"","cacheResults":true,"hideOnError":false,"rendered":true,"showRefreshButton":true} |
If you want to take a look at the report fields information, the KPI detail page has a button labeled View Details that should take you to the Visualforce page that displays some report runtime information.
- In the KPI record detail page, go to the Related tab and click new on the KPI Domains related list.
- Provide the following fields:
| Field | Value |
|---|---|
| External Id | ClosedOpportunities |
| Chart | Progress |
| Dashboard | DS-0001 (search for the one with external id = FieloPLTDashboardIncentivesDefault) |
| KPI | Closed Opportunities |
| Metadata | {"runMode":"sync","showAnimation":true,"limit":10,"size":"1x1"} |
| Order | The last existing order in the chosen dashboard +1 |
- Access the Home tab in the Fielo Platform. The new KPI should appear in the Program tab inside the Command Center.