
Salesforce Dashboards
Display program reports on dashboards
A great way to display reports is from the Dashboards tab of your Program. Dashboards is native to Salesforce and is the best place to go if you want to create a Report on your Program as a whole.
The Dashboard provides a snapshot of your Program-wide Reports summarized with the total of number users, Points, or engagements, month-over-month growth percentage, and a sparkline to show trending behavior for the past 30 days.
Creating a Dashboard
If you wish to use Salesforce's dashboards along with Fielo's Command Center, the very first step is to add the Dashboard tab into your Fielo Platform view. For that, click on the 🖊️ icon at the end of the navigation bar, select Add More Items, and look for "dashboard". Hint: select the first result.
Click on Add 1 Nav Item and then Save.
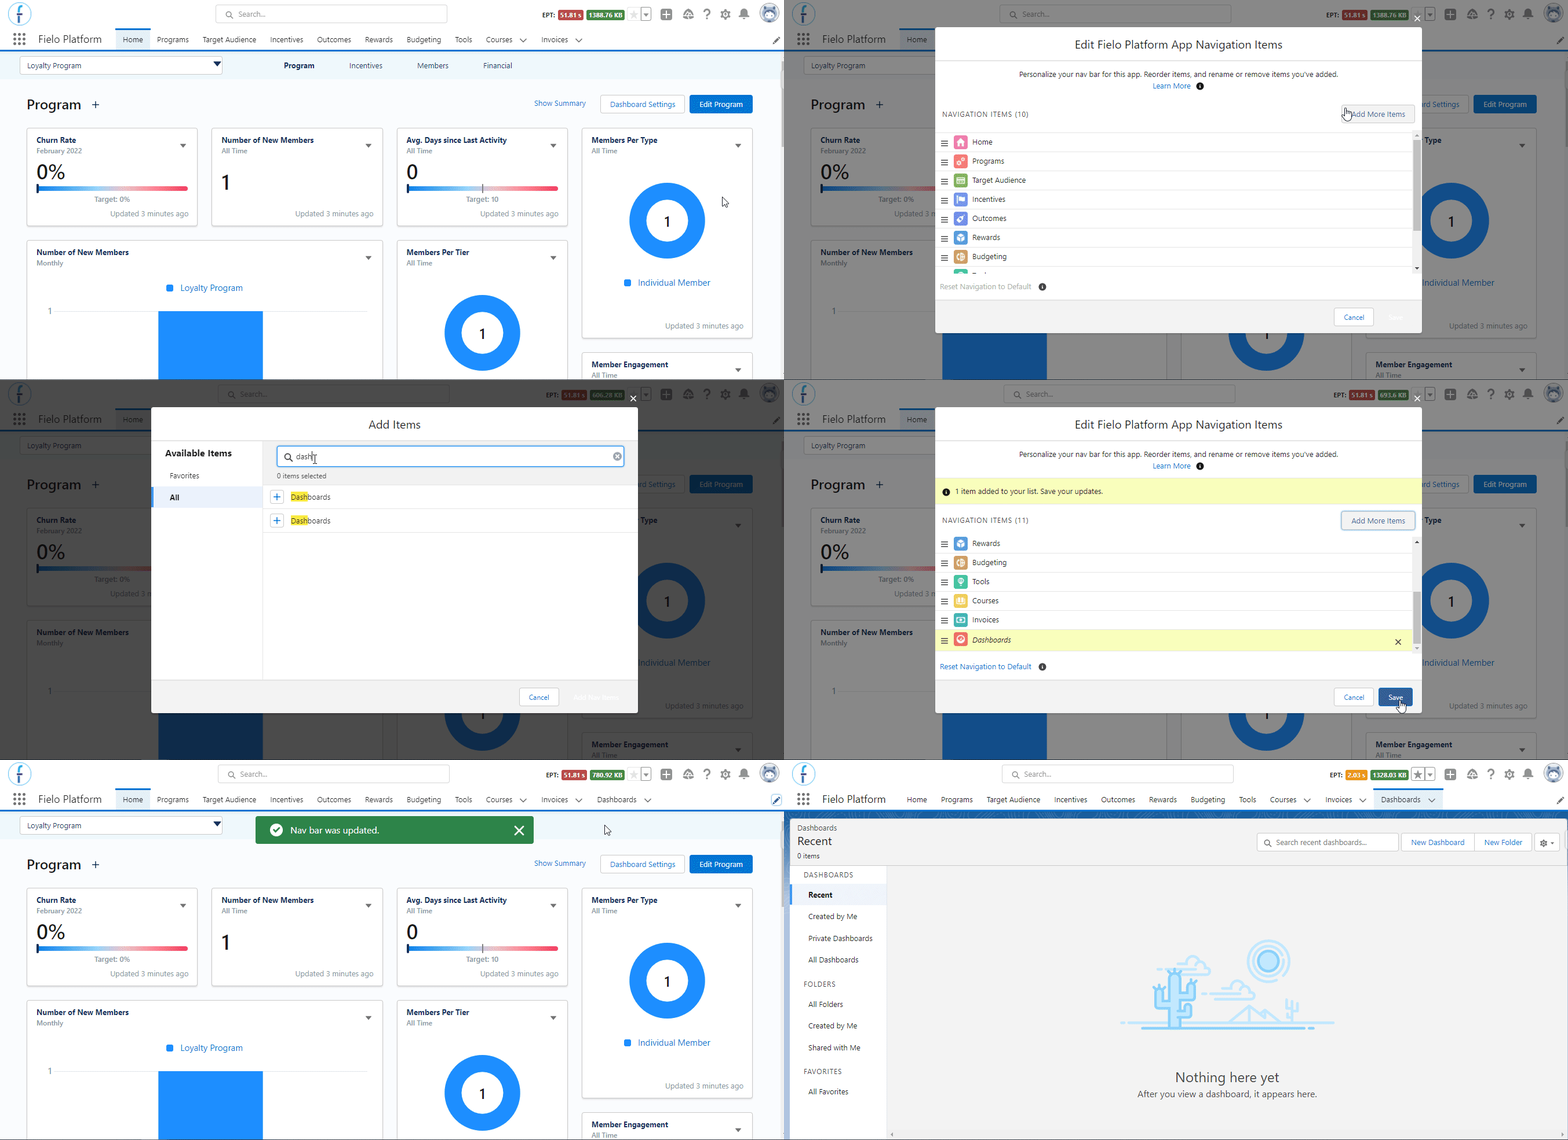
Adding Dashboard tab
Once you've clicked on the Dashboards tab, you'll see that there are a few categories listed along the left-hand side of the screen. You can select Recent, Created by Me, Private Dashboards, or All Dashboards.
To make a Dashboard, click on New Dashboard.
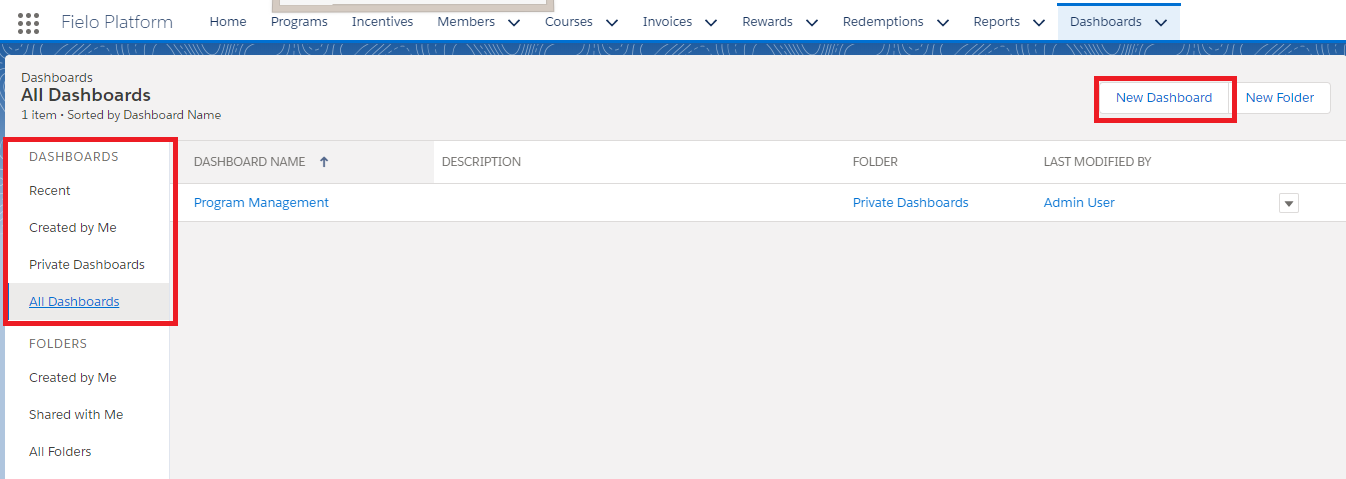
New Dashboard
Then fill out the following information:
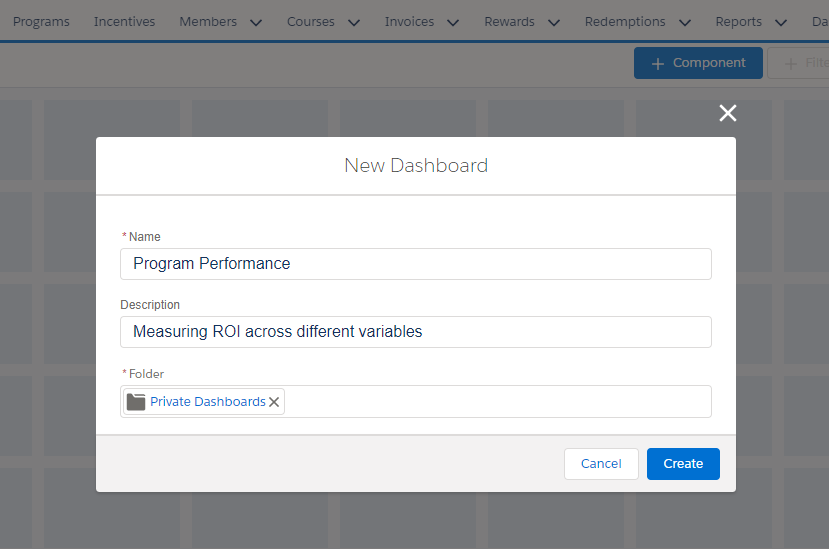
New Dashboard
- Name: Give the Dashboard a name which corresponds to its overall purpose.
- Description: Describe the function of the Dashboard. What are you trying to learn and demonstrate?
- Folder: Which Folder would you like it to be stored in?
When you have filled this in, hit Create.
With a blank slate in front of you, begin creating Reports by clicking on the *Component button.
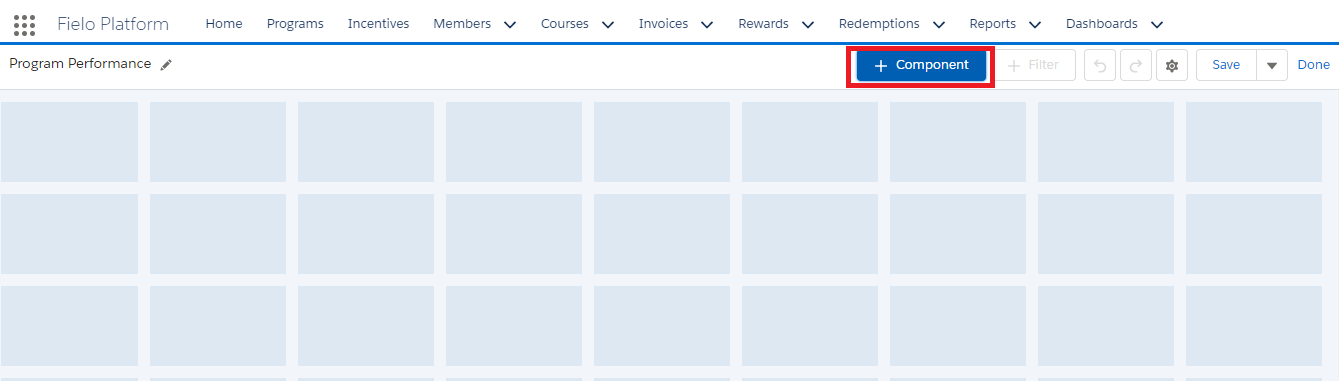
New Component
Then select a Report you want to be included on your Dashboard. All of the Reports which you made earlier, will appear in the pop-up window.
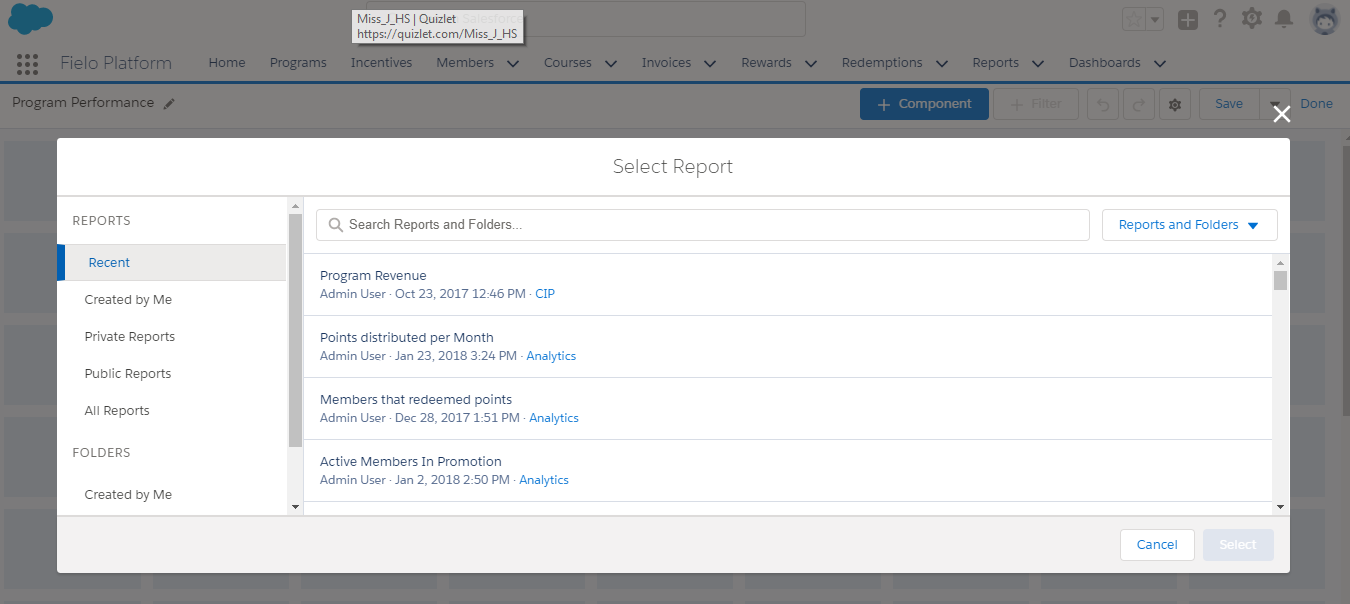
Selecting a Report
Once you've honed in on the one you want, click Select. You will then be taken to a new window where you can decide the way you want the information to be displayed. Bar graph? Chart? Infographic? Play around and see what fits best.
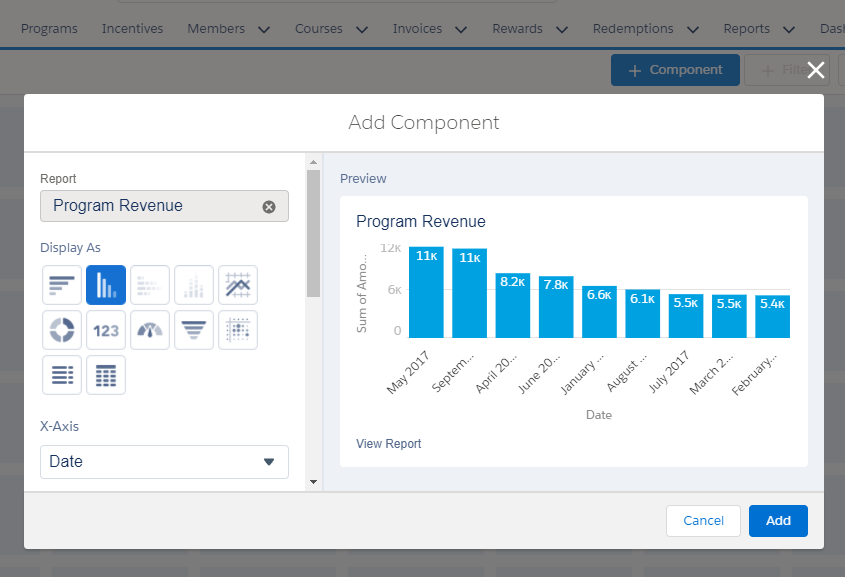
Visualizing the data
Once you're happy with your choice, select Add. And presto! The Report will be displayed on your Dashboard.
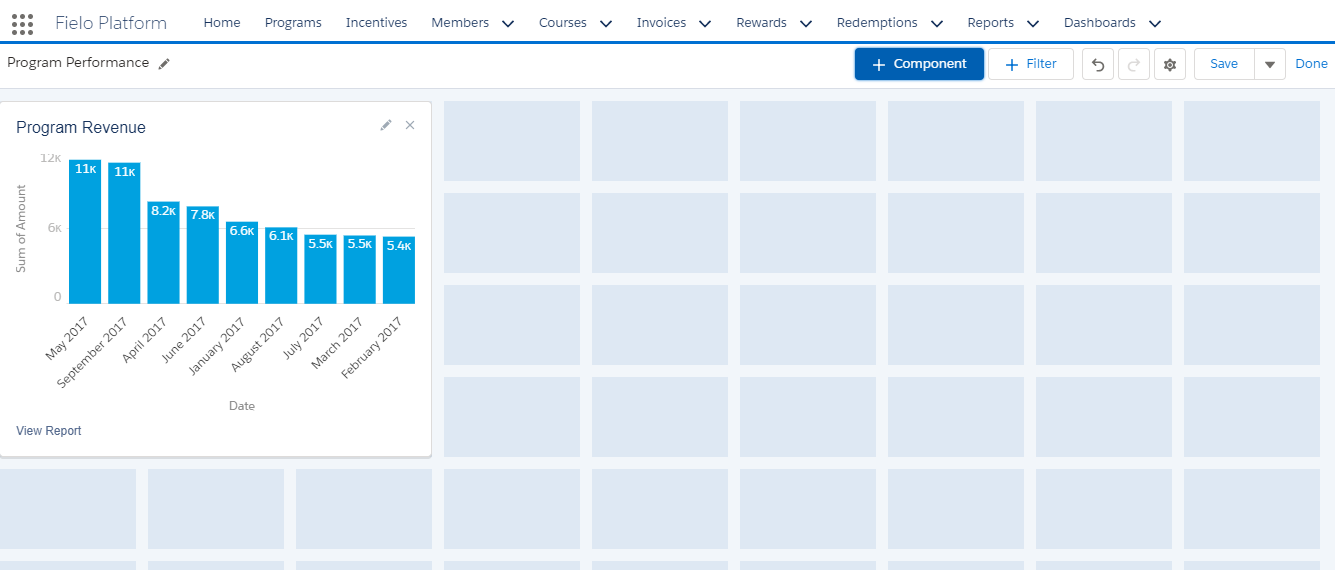
Report on Dashboard
Now continue adding reports to your dashboard as you see fit! The more the merrier.
Updated over 1 year ago