
Program Reports
Use the reports in the Command Center to keep an eye on your program's most relevant metrics
The Command Center gathers the dashboards related to all the reports that come with the Fielo package, offering you an easy way to access them and to overview each program's statistics. This is where you will find all the data you might need to help you make better and more intelligent decisions related to your program.
The dashboards are divided by category so that you won't need to look all over to find a specific report:
- Program
- Incentives
- Members
- Financial
The Command Center is located within the Home tab, which makes it the first thing that you will see whenever you enter the platform, placing the reports in the spotlight of Fielo Platform. Moreover, if you have more than one program, you can change from one program to the other by clicking on the right next to the program name at the top bar and selecting it.
Now that you understand what the Command Center is and its objectives, let's see some more details and explain some concepts.
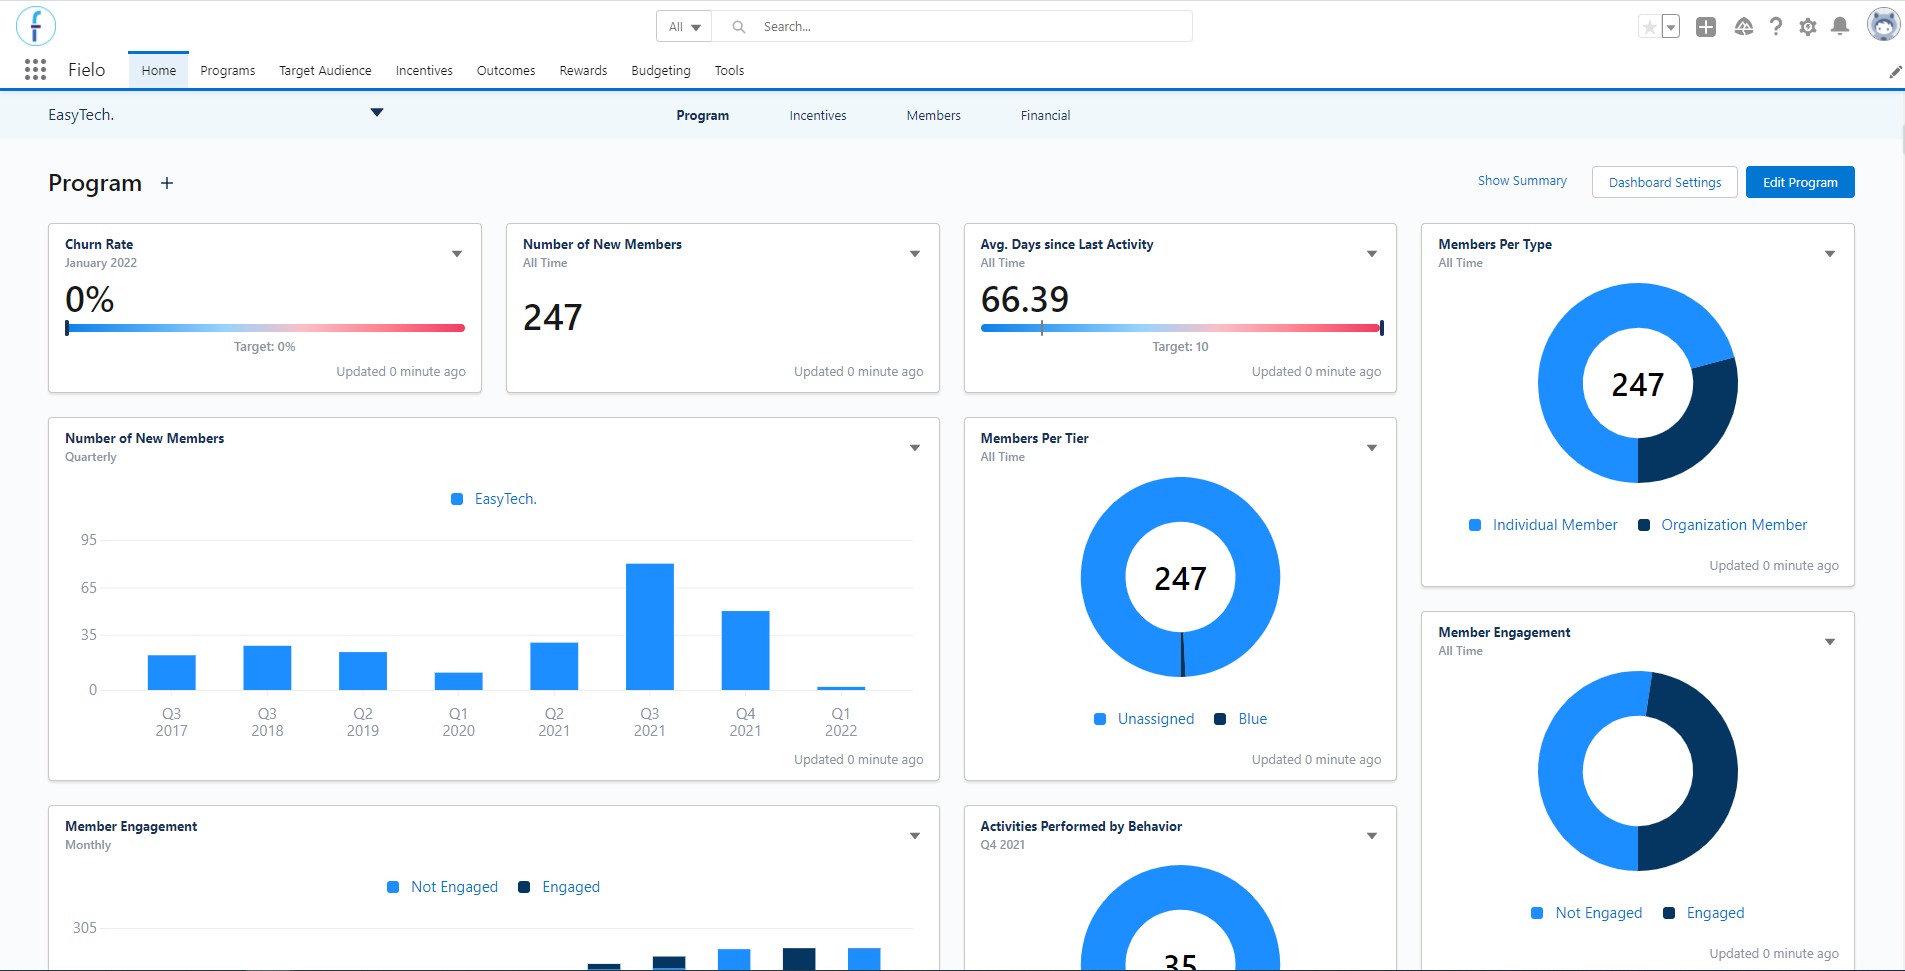
Command Center
KPI Settings
To edit a KPI's configuration, click on the at the top right corner of the tile and then click on KPI Settings. You will see the KPI's options that you can change so that it is displayed the way that you prefer.
Check the settings options below, but note that not all of them are available to all chart types.
-
Target
Set a quantifiable objective for the KPI, so that you can see how far you have come in reaching or surpassing them. The Dashboard's tooltip (i.e. mouse over) will display the target number, as well as the reached percentage so far. -
Time Unit & Accounted Period
Define the period that the KPI's data will be related to. Make sure to choose the time unit (weekly, monthly, quarterly, yearly, or all-time) first and, then, select the accounted period that you want the KPI to cover. For example, if you choose yearly as the time unit and 1 year ago as the period, then the KPI will only display the data related to the last year. Depending on which year you are currently in, the year displayed will change: it will always be 1 year ago (or one week/quarter/month ago).
If the Time Unit is set to "All Time", then the KPI will show the data related to all the time in which the program has been active. You won't need to choose an Accounted Period. -
Number Format
There are two options within this: decimal or percentage. If you prefer to see all KPI numbers in their percentage format, rather than as decimals, then select percentage. Since the percentage is calculated based on the target, be sure to set a target if you choose this option. -
Include only active members
If inactive, then the KPI will take into account all the members, no matter in which status (active, submitted for approval, rejected, pending user, pending merge, blocked, opt-out, anonymized, banned, or merged) they are on. If active, which is the default, the results will be related only to the active members. -
Show Total
It shows the total number when active . -
Show Detail
It shows the numbers divided by each period (accounted period) when active . -
Number of Results
Within the List chart type, you can choose the number of rows displayed: it can be any value from 1 to 200 rows (lines). If you choose a number lower than the total quantity of records that could be shown, then the KPI will display only those with the highest results. For example, it will display the top 10 redeeming members if you enter "10" in Limit, even if there are 100 members in your program. -
Color Gradient Variant
This is a visual configuration. In the Progress #2 chart type, the progress bars have colors and you can decide if they go from blue to red (default) or from red to blue (inverse).
About KPI
Click on at the top right corner of the tile and select About this KPI to see the KPI's description.
This option allows you to have easy access to a brief description of the data that each report delivers, as well as how the results are calculated and to which fields or objects it is related (if applicable).
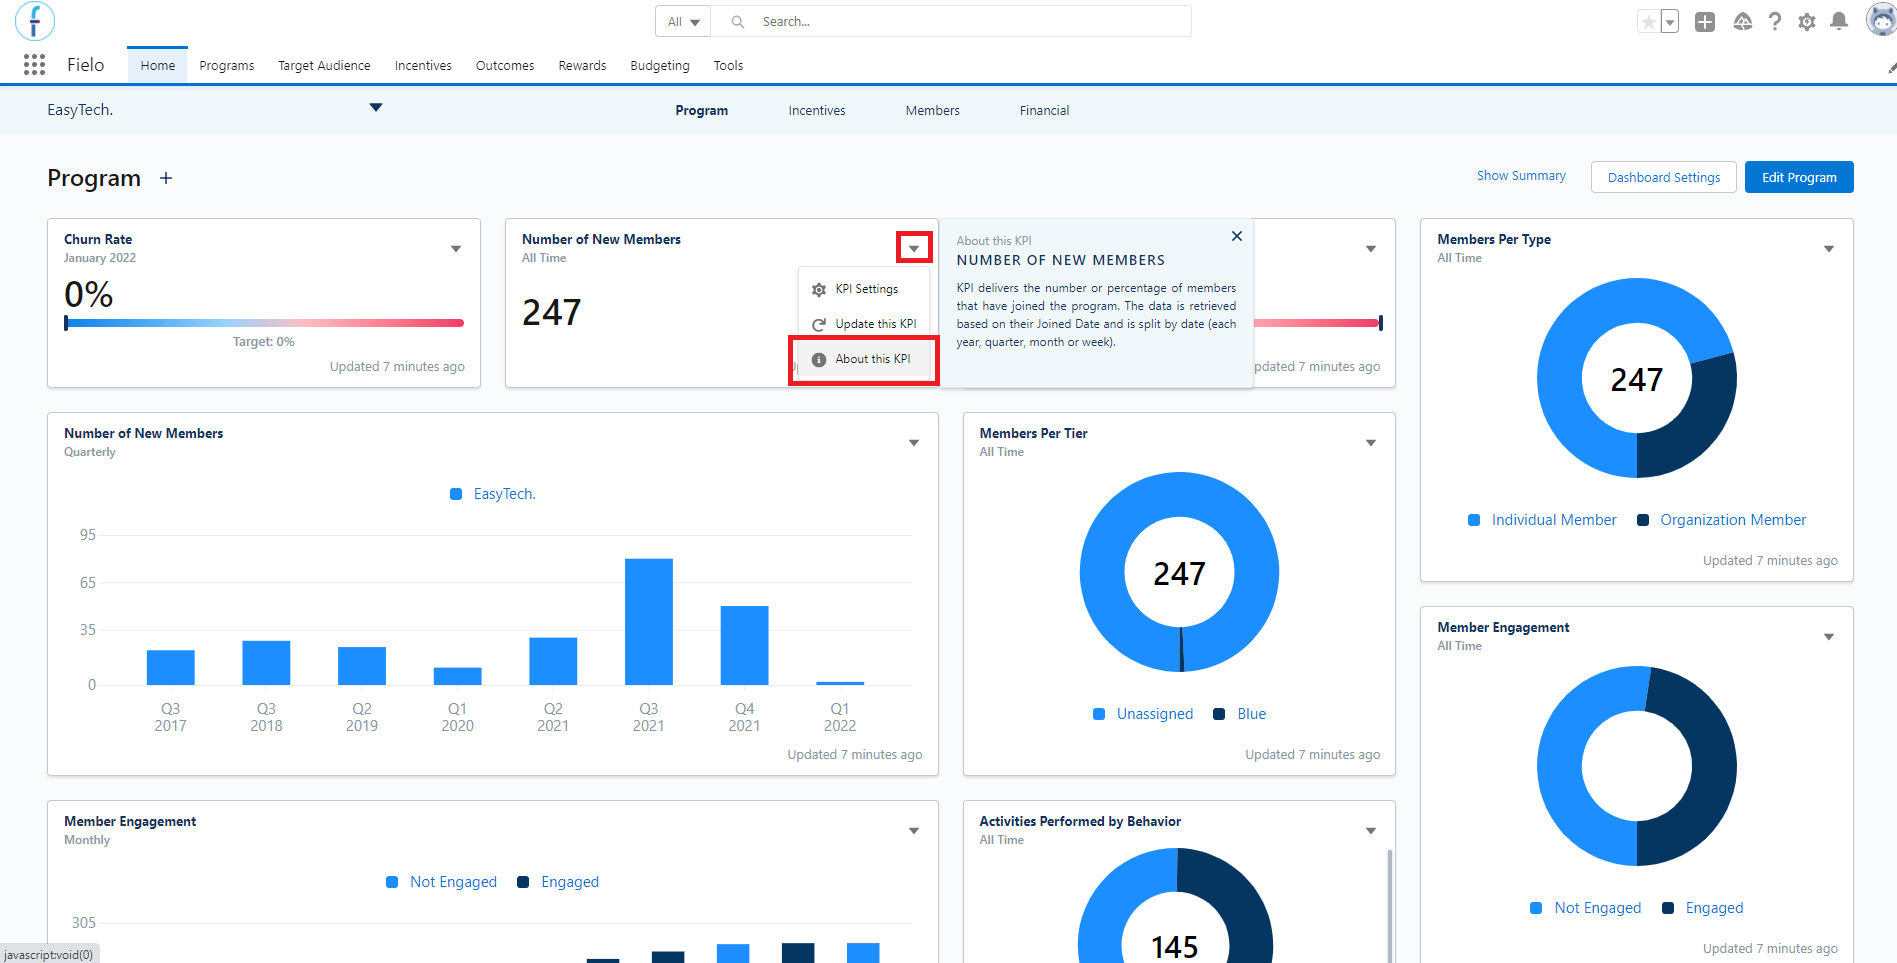
About KPI
KPI Tooltip
Hover your mouse over the KPIs in order to see more information about each of the sections. The tooltip displays information such as the percentage that a section represents of the total, the percentage of increase/decrease when comparing different periods, and how much of the target was reached.
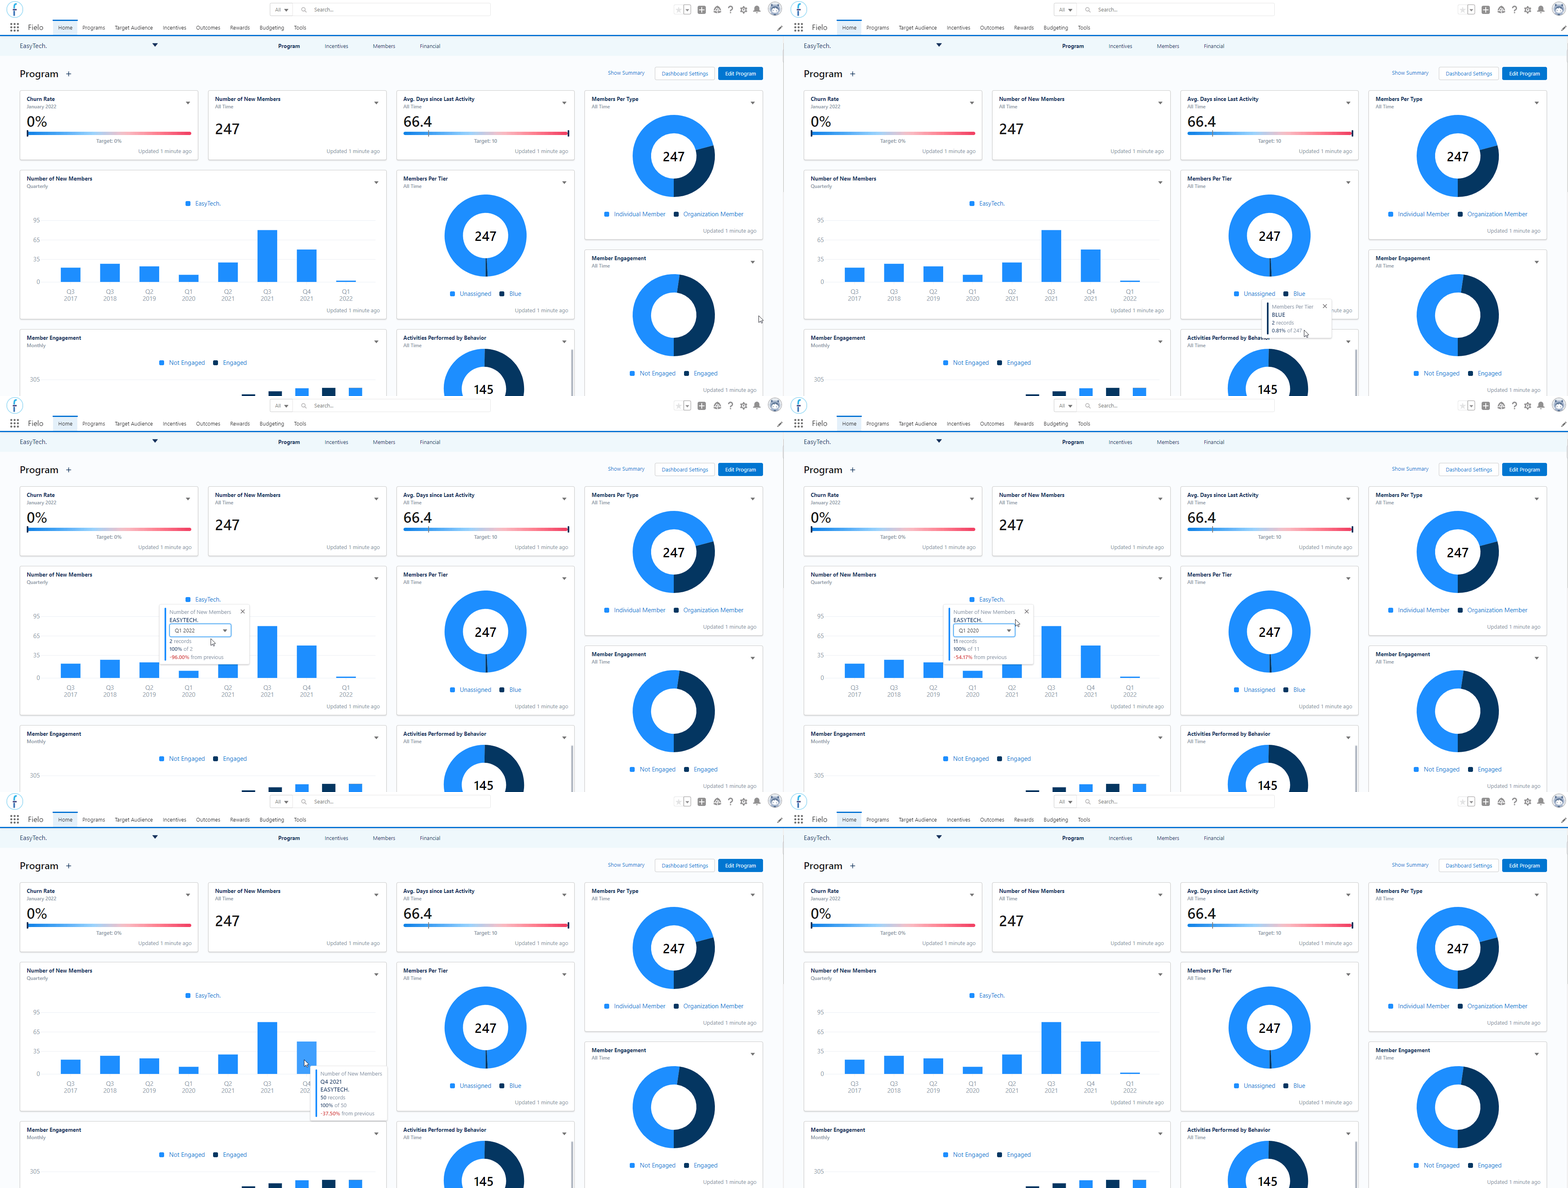
Tooltip
Reports
Find a list of all Fielo default KPIs below.
Program
- Number of New Members
- Members Per Tier
- Members Per Type
- Top Redeeming Members
- Activities Performed By Behaviors
- Points Expiration Rate by Tier
- Points Redemption Rate by Tier
- Member Engagement
- Top Engaged Members
- Churn Rate
- Average Days Since Last Activity
Incentives
- Activities Performed by Behavior
- Rewards Given
Members
- Number of New Members
- Members Per Tier
- Members Per Segment
- Members Per Status
- Top Engaged Members
- Members Engagement
- Member Activities by Behavior
- Total Members
Financial
- Points Delivered
- Points Expiration Rate by Tier
- Points Redemption Rate by Tier
- Payouts Fulfilled Per Incentive
- Redemptions Cost
- Incentivized Behavior Types
Resources
Check out our articles where we have more in-depth information about the Fielo features that were mentioned here:
Updated over 1 year ago