
Analytics
How to make Reports, set KPIs and configure Dashboards
Analytics allows you to make reports on the success of your Program based on tonnes of different criteria. You can break it down to look at Member onboarding, monthly stats, and Promotion performance, amongst many other things. You can also see all of the stats in a really clear and visual way.
Our Analytics functionality is built directly on Salesforce so it uses the wealth of information Salesforce puts at your fingertips - ranging from real-time snapshots of your business to yearly summaries. An independent survey of more than 4,000 Salesforce customers found that these analytics were able to cut the time people needed to prepare Reports by an average of 52 percent.
By always knowing where you stand, you can spot trends early and make the best decisions for your business.
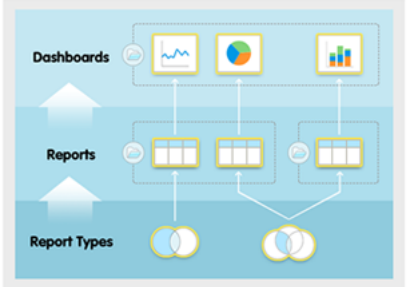
Salesforce Analytics model
Reports and Dashboards can be summed up in just two sentences: Report types are the templates from which users build reports, which organize data and are shared via folders.
Reports are also the source for dashboard components, which visually display data in dashboards.
Okay, two rather long sentences - but that's it, in a nutshell. If you understand these relationships, you're already off to a great start!
How the Pieces Work Together
Reports and Dashboards consists of several integrated parts:
Report Types
A Report Type defines the set of Records and Fields available to a report based on the relationships between a primary object and its related objects. Reports display only records that meet the criteria defined in the Report Type.
Reports
A Report returns a set of Records that meet certain criteria and displays it in organized rows and columns. Report data can be filtered, grouped, and displayed graphically as a chart. Reports are stored in Folders.
Dashboards
You control access to Dashboards by storing them in folders with certain visibility settings.
Dashboard folders can be public, hidden, or restricted to groups, roles, or territories.
Folders
A Folder is a place where you can store Reports and Dashboards.
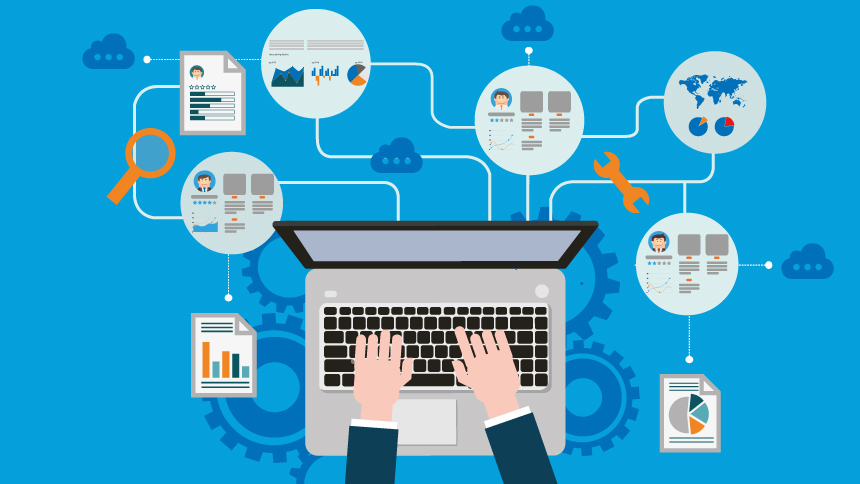
Analytics
Making a Report
- You create a Salesforce Report.
- You make a KPI, which tells Platform how that Salesforce Report interacts with your objects - Programs, Promotions and Challenges.
- You add that KPI to an existing Program, Promotion or Challenge to get you Reports. Get a full overview of what matters most by configuring the Dashboards you want.
Updated over 1 year ago